

This blog explains the survey process that our engineers conduct when someone inquires about solar panel installation. The survey includes simulation results such as Annual Energy Production, performance ratio, a Detailed Financial Analysis (including Return on Investment and Lifetime Bill Savings), and more.
Financial Overview
This section appears on the first page and provides details such as System Profit (NPV), which considers your current usage and what you are currently paying, as well as the forecasted power your installation will generate.
The Payback Period is also included in this section and is calculated by comparing your potential annual power generation to the amount you could save, based on your current energy provider's rates for your annual consumption.

System Production and Consumption
This section includes a visual representation (in the form of a pie chart). The first chart, System Production, shows the estimated energy your installation will generate, measured in megawatt-hours (MWh).
The Consumption pie chart shows your total consumption based on your current usage, as well as potential ‘self-consumption’ from your installation, represented as a percentage of your total consumption. These figures are also shown in megawatt-hours (MWh).

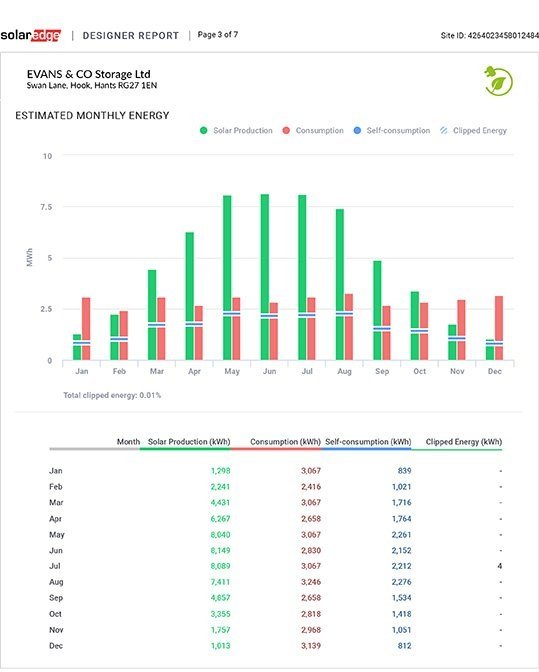
Estimated Monthly Energy
This page provides a month-by-month breakdown of your Estimated Energy Consumption in an easy-to-understand bar chart, along with the corresponding figures in a table below. All figures are given in megawatt-hours (MWh) for consistency and are forecasts based on your specific installation.
For comparison, the chart also shows your estimated consumption, so you can quickly see what you are generating versus what you are consuming. As expected, the chart and figures below reflect higher production during the summer months.
Estimated Bill Savings
The next page shows the Estimated Bill Savings for both the first year after installation and the forecasted savings over the 20-year lifetime of the installation. For this particular installation, the estimated Net Monthly Bill Saving is £775.96, which translates into an estimated Net Lifetime Bill Saving of £234,333.

Detailed Financial Analysis
This section shows the System Profit, calculated by subtracting the System Price from the Lifetime Bill Savings.
Additionally, it includes the Internal Rate of Return (IRR), a percentage that estimates the profitability of a solar project. The IRR is calculated using a financial formula that includes the PV energy price and cash inflows. An IRR of 20% means the investment should generate a 20% return each year.
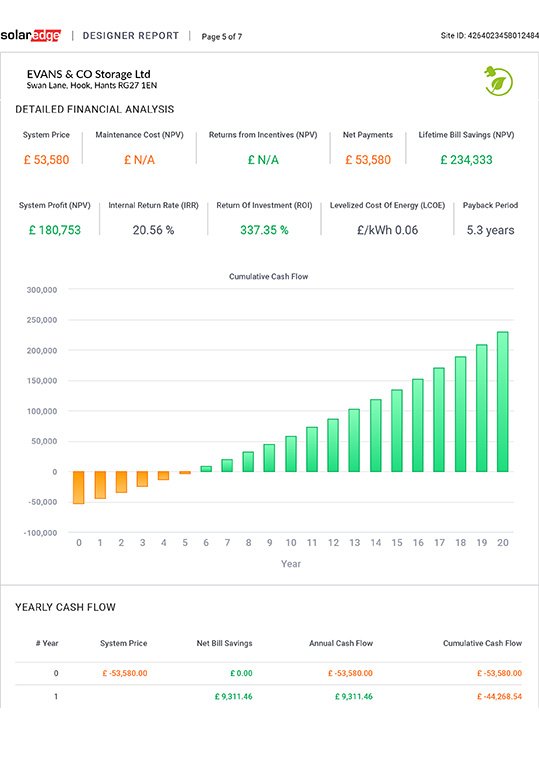
Yearly Cashflow
This page continues from the previous one and shows the Net Bill Savings year by year over a 20-year period.

System Loss Diagram
This page documents some of the potential system losses and factors in various variables, including environmental factors such as shading.
There will always be some loss during the conversion from Direct Current (DC)—the energy generated by your solar panels—to Alternating Current (AC), which is used in properties. This is entirely normal and is always documented in the survey report.
